Climate audit · 25 meteorological years

Hours without rain or strong thermal stress.

Daytime (8am–10pm), audited over 25 years.

The rain you avoid. The comfort your people will actually feel. Daytime hours, 8am–10pm local. Audited, not averaged.

From a real audit · Harbor Island, Bahamas

April 30: 0.5 hrs of pleasant outdoor time held in 24 of 25 years. May 8: 10.5 hrs. Same venue. Eight days apart.

The 25-year audit shows the difference the decision-maker can't see. See the full audit ↓

The Audit · scope
5.4 M distinct microclimate-aware points worldwide
0.1° grid (~11 km) · 90°N → 60°S (excl. Antarctica)
25 years × 28 daytime slots
30-min temporal · 8am–10pm local · 25 met-years
~26 billion daytime observations
behind any single date of the year
What we measure

Three things weather data usually fails to tell you.

A forecast says what's coming in the next days. An average says what's typical. Forelore tells you which dates hold the highest pleasant-hours floor — the daytime hours that have held up in 24 of 25 years over the last quarter-century.

Weather forecast

"What will happen Thursday?"

10-day outlook, hour by hour. Useful 7 days out, useless 18 months out when the booking is made.

Wrong question for a long-lead-time decision.
Climate averages

"What's typical for September?"

Numbeo, Wikipedia, climate.gov. Average pleasant hours hide the variance — and an outdoor event is one specific day.

Right granularity, wrong statistic.
Forelore Audit

"Which dates hold the highest floor?"

For your venue, on this date, the floor of pleasant daytime hours that held in 24 of 25 years — observed, not modeled.

Built to be defensible to the decision-maker.
Sample audit · Harbor Island · wedding date selection

Where the wedding calendar is wrong by a week.

Two dates, eight days apart, both inside what every wedding calendar calls "peak shoulder" season. The 25-year audit shows one is a cliff, the other is the start of a four-day sweet spot.

April 30 — the week before
0.5hrs
floor (3-day window) / 14 daytime hrs · 8am–10pm local
May 8 — the window
10.5hrs
floor (3-day window) / 14 daytime hrs · 8am–10pm local

Same venue, 8 days apart. +10.0 hours of usable outdoor time per day.
Industry says peak season. The audit says not until May 7.


The 30-day window

The transitional period, day by day · April 15 – May 15

Each bar is one calendar day. Height = the 3/3 wedding-mode floor for that day — the worst plausible value, in 24 of 25 observed years, for a 3-day event centered on that date.

Harbor Island day-by-day 3/3 floor heatmap, April 15 to May 15
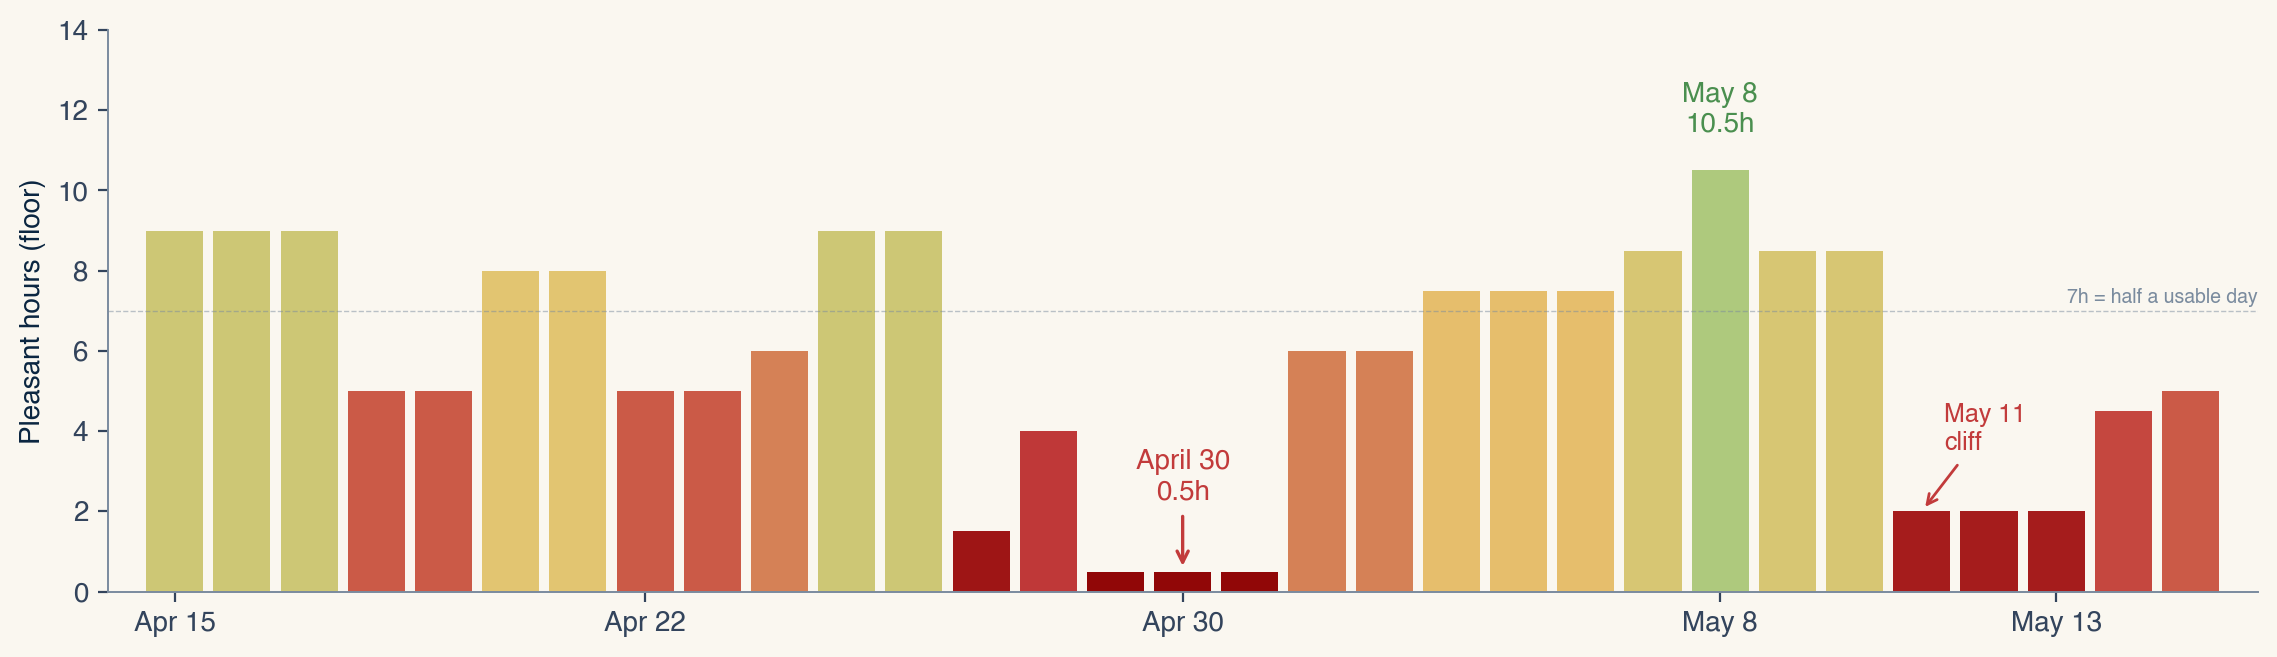
Inside the same 30-day window, the floor swings from 0.5h to 10.5h.
Only May 7–10 hold an 8.5–10.5h floor — a four-day sweet spot inside the shoulder. The week before is a cliff. The week after is the start of the wet-season ramp. The audit lets you place a wedding inside the protected window with confidence, not hope — and steer clients away from a period the industry typically considers safe but the data shows isn't.

Audited over 25 years

24 of 25 years held two very different floors
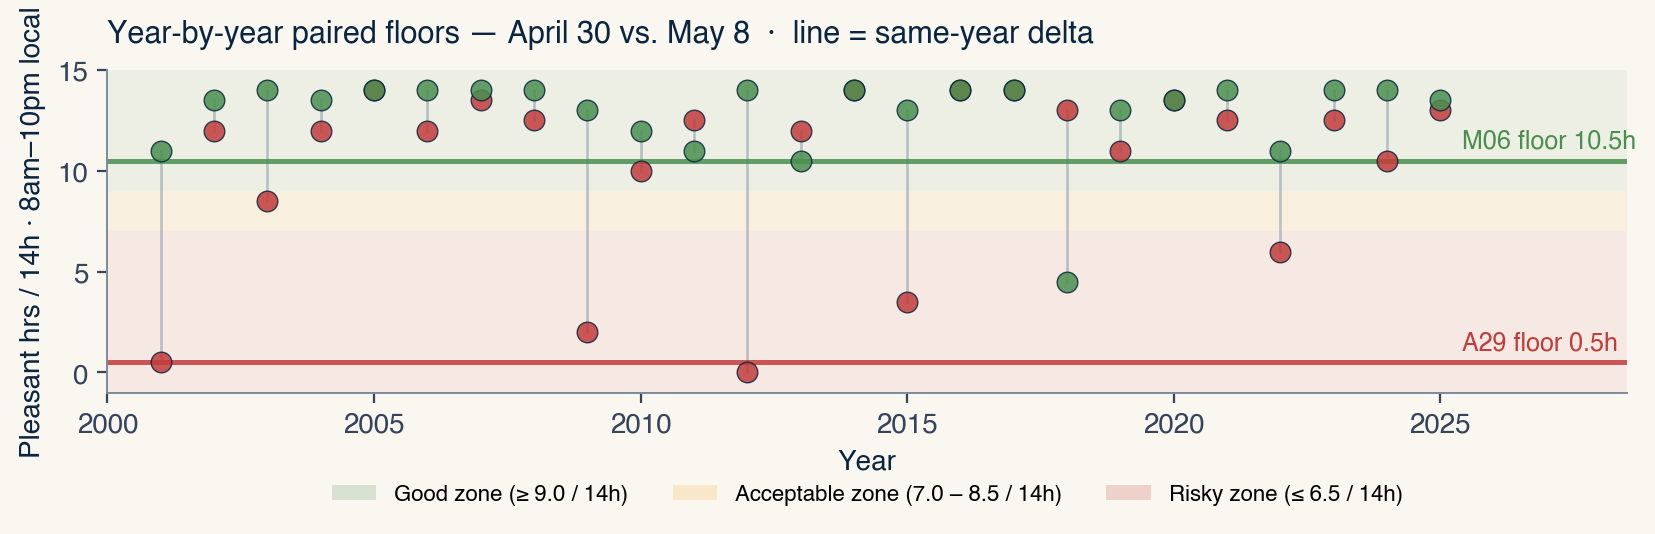
Each dot is one year's 3-of-3-day floor (2001–2025) for the date shown. The audited "floor" is the 2nd-lowest of 25 — held in 24 of 25 observed years. No averages.

Harbor Island 25-year 3/3 floor distribution for April 30 vs May 8
0.5h
April 30 floor
10.5h
May 8 floor

Talking points · use with your client

What this means for the decision-maker

The audit is a defensible floor — the worst plausible day, not the average day — that lets you anchor a date conversation in 25 years of observed climate.

"April 30 is riskier than May 8 — and the difference is not subtle."
A 3-day event centered on April 30 historically clears only 0.5 daytime hours in the worst plausible year. The same event centered on May 8 clears 10.5 hours. Same venue, eight days apart.
"Booking 8 days too early may cost +10h of outdoor time per day."
Industry calendars call the whole window "shoulder season." The audit shows a sharp cliff inside that window. May 7–10 is the protected sweet spot — most of April pays a steep tax.
Three ways customers use Forelore's audits
LOCATION-FIRST
Client locked the venue. Audit reveals the protected dates inside the window they assumed was all "peak."
DATE-FIRST
Client locked the date. Audit ranks the candidate venues on that specific date.
TAILOR-MADE
Standard audit covers most weddings. For non-standard cases — nighttime ceremonies, beachfront receptions, altitude venues — thresholds and time windows adapt to the actual question being asked.

Methodology · observed 25-year data
NASA IMERG (rain) + Copernicus UTCI (thermal comfort) · 0.1° lat/long · 30-min temporal · 8am–10pm local. High-confidence floor = 2nd-lowest of 25 observed years (2001–2025), 3/3-day window × 24/25 cross-year — ~90% one-sided confidence after climate-autocorrelation adjustment. Read the methodology note.
Pricing

Start free. Pay per venue-date.

The atomic unit is one venue-date (1 venue × 1 date). Every tier delivers the same audit-grade PDF — same methodology, same 25-year data. Tiers differ in volume, geographic coverage, and workflow features. Monthly billing available on every paid tier · cancel anytime · venue-dates delivered at a steady monthly pace (5 / 15 / 30 per tier).

Try us first
Glimpse
$0 · one-off
1 venue-date PDF audit. Free, 24-hour email delivery, no commitment. See the deliverable before you buy.
  • 1 venue-date (= 1 venue × 1 date)
  • Same methodology as paid tiers
  • Delivered via email within 24 hours of request
  • Once per business / lifetime
Request free sample
One-shot
Single Audit
$199 · one-off
2 venue-dates side-by-side in one PDF (the Harbor Island format above). No subscription, no commitment.
  • 2 venue-dates in one PDF
  • Choose: 3-day wedding window or 7-day vacation window
  • One-off purchase, 24-hour delivery
  • 48-hour replacement guarantee
Request access
Multi-region operators
Studio
$450/mo
Or $4,500/yr · save 17%.
  • 15 venue-dates/month · up to 5 regions
  • 5 reverse queries/month
  • White-label co-branded reports
  • Custom event windows (5-day, 14-day, etc.)
  • Everything in Pro
Request access
Destination · multi-market
Atelier
$900/mo
Or $9,000/yr · save 17%.
  • 30 venue-dates/month · up to 10 regions
  • 10 reverse queries/month
  • Everything in Studio
  • Designed for destination weddings, vacation rentals, and multi-market operators
Request access
Tailor-made
Enterprise
$18k+/yr · custom
Custom scope for non-standard use cases. Volume, geography, thresholds and report format defined per engagement.
  • Unlimited venue-dates · global coverage
  • API access · bespoke claude-narrative reports
  • Dedicated account manager
  • Pilot scope tuned to your portfolio
Discuss a pilot

A region = 150-mile radius around any centroid you declare. Pricing in USD, indicative — final terms confirmed via consultation. All tiers cancel anytime. Annual prepay saves 17% — same monthly venue-date delivery rate.

Methodology

How we measure pleasant hours.

Two ways to ask the engine.

Forelore's audit engine answers two queries over the same 25-year climate floor dataset:

Location → Calendar

"At this venue, when?"
You give a venue. The audit returns the year-round rhythm of pleasant hours — 365 days of floors — to compare candidate dates, identify sweet-spot windows, or score the full annual fingerprint.

Date → Map

"On this date, where?"
You give a date or window. The audit returns the global ranking — 5.4 million distinct points — to compare candidate destinations, build short-lists, or rotate a portfolio of venues.

The Harbor Island case study above is the first query type, applied to a wedding date selection. The same engine serves vacation rentals, property buys, festivals, multi-venue portfolios, and destination comparisons.

Microclimate-aware. Not a regional average.

Forelore audits at 0.1° lat/lon resolution — each pixel is approximately 11 km × 11 km, the size of a small coastal town. Two villas 20 km apart on the same coast may have meaningfully different floors. The audit is venue-specific: your exact location, not a regional or city-level smoothed average.

Rain — the primary filter.

An outdoor event lives or dies on rain. Forelore uses NASA GPM IMERG Final V07 — the gold-standard satellite precipitation dataset, with 0.1° lat/lon resolution (~11 km) and 30-minute temporal cadence. Each 30-minute slot counts as rain-free below 0.1 mm/h rain rate. No rain, no event lost.

Why satellite rain, not reanalysis? Validated against NOAA Stage IV gauge ground truth, ERA5 reanalysis exhibits a −2.3-hour drizzle bias in places like Miami — counting low-rate rain the gauges don't register. IMERG matches the gauge within ±0.4 hours. The choice of rain dataset alone can shift the audit by hours per day.

Then: strong thermal stress.

Once rain has cleared, what's left is thermal comfort. A 30°C day with full sun, no wind, and 80% humidity feels around 38°C to a person standing outside in formal clothing — the thermometer reads 30°C, the body feels 38°C. Forelore measures what your people actually feel, using the UTCI (Universal Thermal Climate Index) — the scientific standard for outdoor thermal stress.

UTCI uses 4 inputs (not just temperature).

UTCI consumes air temperature, mean radiant temperature (sun + ground + buildings), wind speed, and water vapor pressure (humidity). It accounts for all of them simultaneously using a 6th-order polynomial fit (Bröde et al. 2012, IJBM). Below −13°C or above +32°C UTCI, the body experiences strong thermal stress — those hours are excluded from "pleasant" in the audit. The UTCI dataset is Di Napoli et al. 2021 (DOI 10.1002/gdj3.102), published in Geoscience Data Journal.

Why ~90% one-sided confidence.

When Forelore reports a "high-confidence floor" of X hours of pleasant weather, what we mean is: at this venue × date, 24 of the last 25 observed years matched or exceeded this floor. That works out to approximately 90% one-sided confidence — the inter-annual climate variability has been measured directly, not modeled.

Why "~90%" and not "96%" (= 24/25 raw)? Because successive climate years are not statistically independent. Multi-year cycles like ENSO and AMO mean that 25 calendar years carry roughly 18–22 effective independent samples. After accounting for that autocorrelation, the confidence is conservative at ~90%.

What this means for you: in any single future year at this venue on this date, there is approximately a 1-in-10 chance that the pleasant-hours value will fall below the floor. The audit's job is to tell you what the worst plausible value has been.

ENSO sensitivity: our 2001–2025 sample contains 3 La Niña / 5 El Niño / 17 Neutral years (long-run climatology ~25/30/45%). Bootstrap re-weighting to climatological ENSO frequencies moves the audited floor by ≤0.3 hours — the 2nd-lowest order statistic already absorbs the worst La Niña year in the sample directly.

Full statistical derivation (Weibull plotting position, climate-autocorrelation adjustment via Bretherton 1999 + Wilks 2011, ENSO robustness analysis, references to David & Nagaraja 2003 and IPCC AR6): read the methodology note.

What Forelore's audit serves today: any single-event venue × date decision — outdoor weddings, vacation rentals, property use-week selection, festivals, single corporate events. Multi-venue annual profiles and portfolio reports are on the Q3 2026 roadmap.

Request audit

One venue. Two dates. Free PDF.

Tell me the venue (or coordinates), and one or two dates. I'll generate a Forelore PDF audit and send it back within 24-48 hours. No signup. No card. If the data tells you what you needed, we talk about a Pro Planner subscription or a property-portfolio pilot.

Or email directly: audits@forelore.ai · LinkedIn